Architecture Modeling at NML
Up to now, NML has followed what everybody in IT would generally recognise as a "sensible" approach to software diagramming. Mostly it consists of drawing blocks with names and connectors trying to represent some logical or physical system layout. I've been working at structuring our approach over the last couple of years so that there is more project alignment and that we can extract more value from our efforts. As you'll see, we did end up at what I would consider a reasonable system, but it has some flaws which we are now correcting by using the C4 modelling paradigm.
NML design strategy to date
The following describes the NML style of modelling we've used until recently.
High-level overview
The diagram type is a depiction of the various logical concepts and ideas that would portray a non-technical view of the system and its integration dependencies. Boundaries with blocks and lines show some kind of connection between elements. The blocks would have a name on them to indicate function or purpose.
The idea behind this diagram was to give some indication about the system's interactions in as non-technical a fashion as possible. Our designers would often convert these into beautiful presentation worthy pictures that clients could use in their slide decks.
Infrastructure
This is where most of our design and architecture work would go into. This diagram contains a lot of technical information and describes the system components, the target infrastructure technology, and how they communicate.
The purpose is here is to be able to show technical people how the system will physically look and interact. It is very information-dense and you need some prior technical knowledge to understand what is going on.
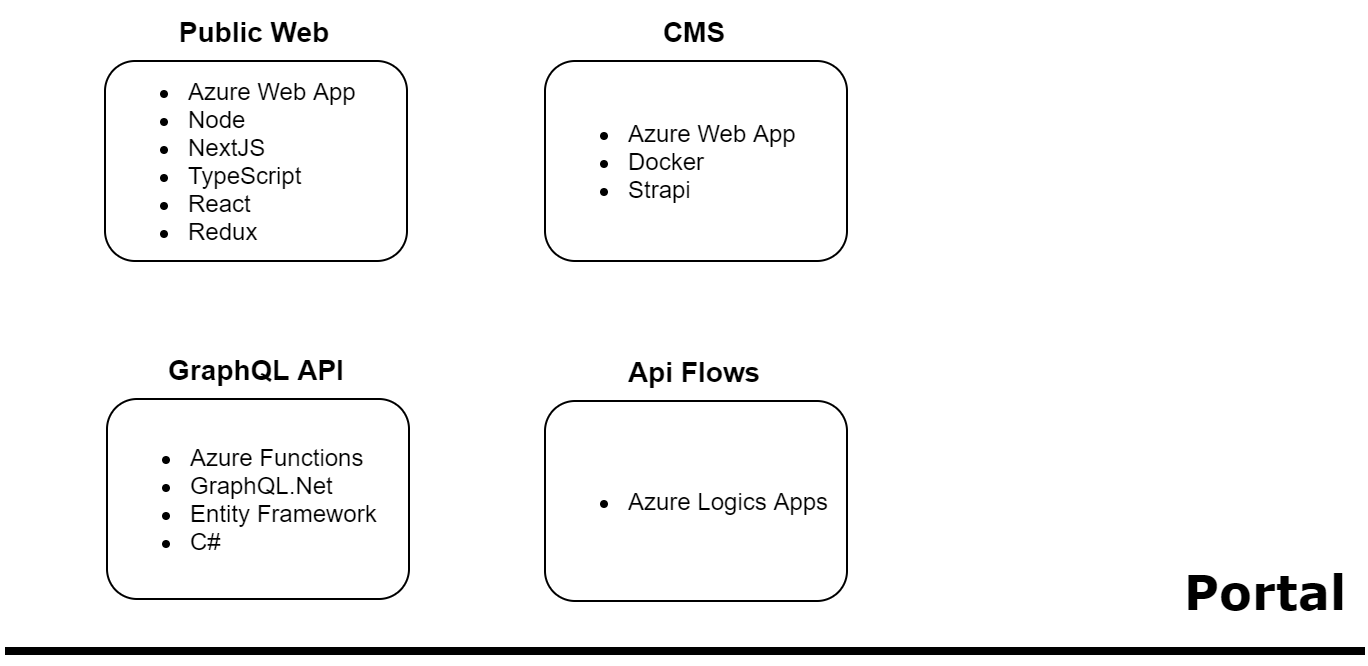
Technology stack
Even though a large part of the target technologies is represented on the infrastructure diagram, it normally doesn't cover all technologies needed to build any specific part of the system under design. We, therefore, produce a technology stack diagram that conveys more of that information.
Other
From time to time we will need some other types of diagrams to relay more technical information. For example, we will draw a UML sequence diagram for sub-system interactions that needs some more clarity or thought put into it.
For messaging systems, we will sometimes diagram messaging and endpoint diagrams to help understand complicated messaging environments.
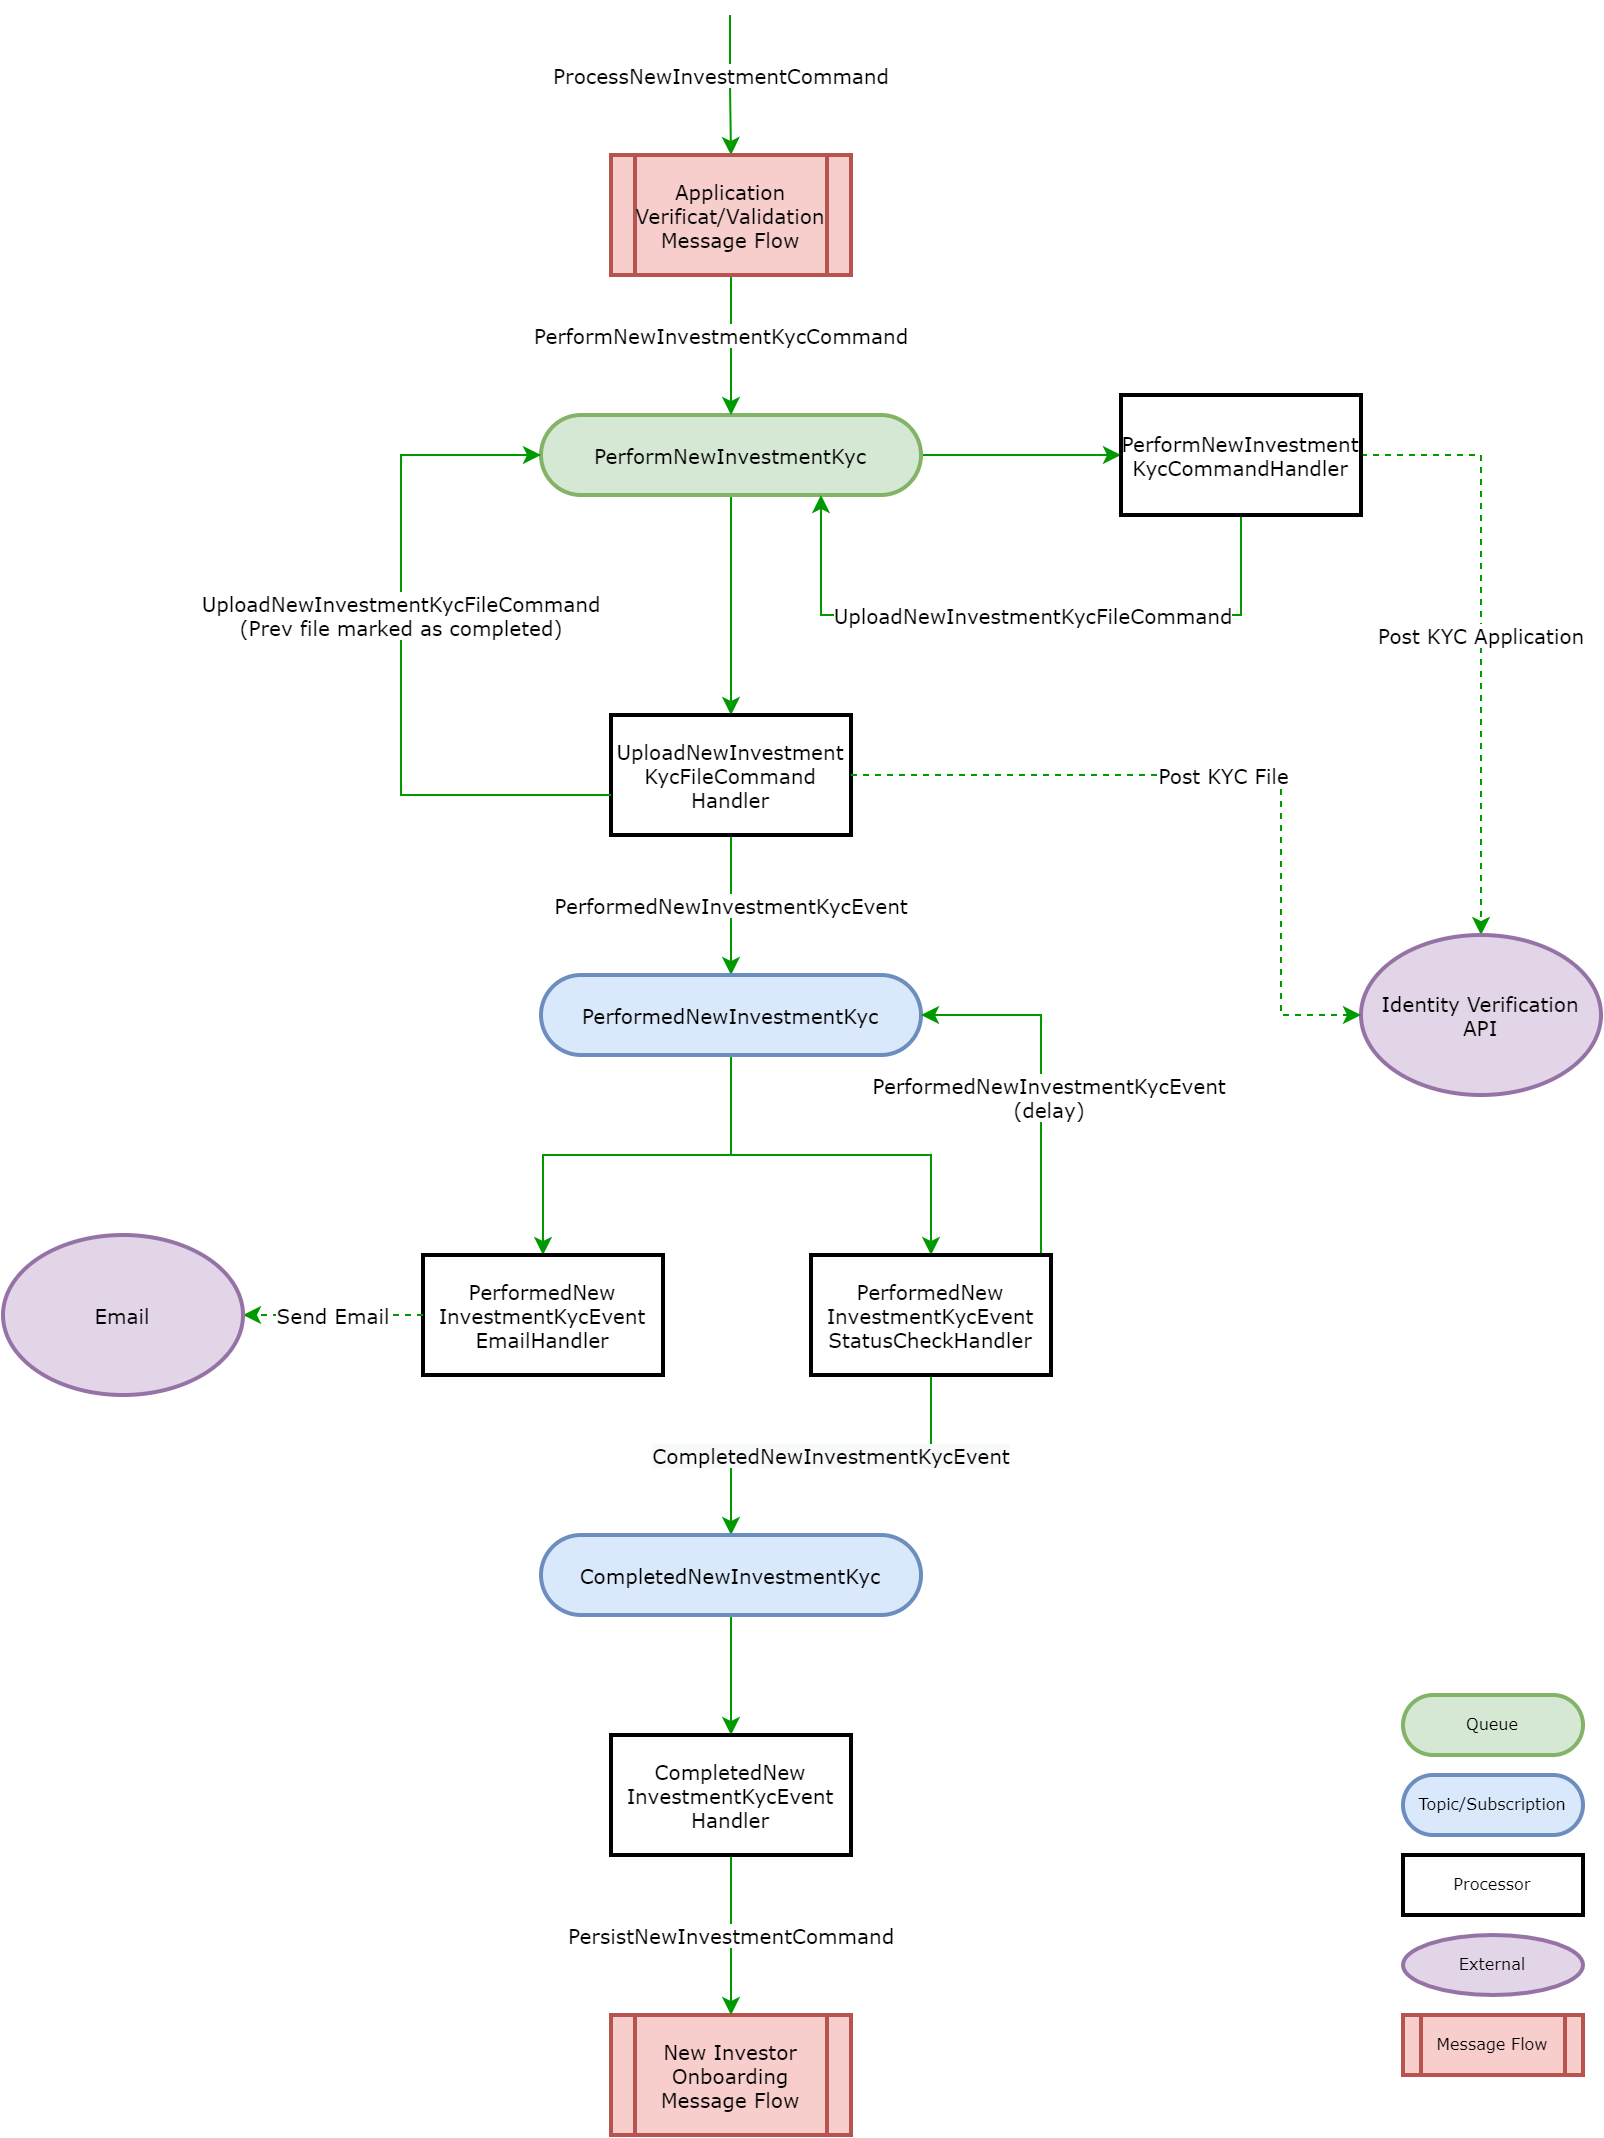
Such lower-level diagrams we only do when more clarity is needed and the effort involved can be justified. It does not help to spend time on drawing up a diagram that doesn't provide useful additional explanatory information.
Need for change
This approach to systems and architectures diagraming works and has been effective for us. I've certainly seen worse! But, I'll admit to drawbacks that I either didn't realise was there or didn't know how to resolve.
Too much or too little information
What I mean by "too much or too little information" is that there is no real guideline about what information is important on the diagram and what isn't. So some aspects can be too technical, and in the context of what you are trying to convey, will add information without enhancing your understanding of the diagram. At the same time, often on the same diagram, you can find elements with a single word name only, which without some prior or specific knowledge would be useless to most people reading the diagram.
There is also a reliance on iconography to relay important information on the infrastructure diagram. Without knowing what the icons mean one can very easily miss that it is important information and just accept it's there for aesthetics.
Diagrams should contain plenty of information, but only information that is relevant to elucidating the purpose of the diagram's existence.
No identified target audience
The high-level overview diagrams outlined above try to be everything for everybody. Clients may like it because it looks nice in a presentation, but the way it was generally structured was also trying to give technical people some information at the same time.
As for the infrastructure diagram, they are very technical and requires quite a bit of understanding of infrastructure. Unfortunately, they were also used to discuss the system with clients, non-technical people, or technical people with a different skillset, and required a lot of explanation. Because the one does not follow logically from the other, you had very little to tie the diagrams together to help you guide the audience through the designs.
Having a specific target audience in mind will guide you in what information is relevant and important for the diagram to effectively communicate its purpose.
No commonality
The aforementioned diagrams have no base concepts or notations in common. They each follow their own practice and notation and going from one to the other causes you to reset your mind restart the learning process about the elements on the diagram.
Common notation makes creating and understanding diagrams a lot easier.
No exploratory power
Each diagram is reflecting all of the system architecture at some level, and none of them helps you in defining the other diagrams. They may cause you to refine, but they don't guide you towards a deeper understanding of the solution step by step. You solve the system architecture by working on all of them.
Being able to use diagramming as an investigative tool to delve into more complex areas of a system architecture helps in understanding the problem you are solving more completely.
Why C4 modelling is our new strategy
I discovered the C4 modelling paradigm while researching how a more effective diagramming tool. I've been recommending diagrams.net (aka draw.io) for creating the diagrams described above. The problem is that diagrams.net is bad at creating UML diagrams, and I had some of my team working on sequence diagrams for some complex designs they were preparing for. One of the team members was showing me a diagram he was still working on, explaining that he'll redraw it in diagrams.net when he is done, but that the tool he was using was just faster to create and modify the diagram with.
The tool in question being PlantUML. I try to never have any sacred cows when it comes to technology as there is always something better around the corner. I support being more effective at how we work at NML above "toeing the line". I started reading up on PlantUML, and as part of their online documentation, they mention C4 Modeling. That led me to watch Visualising software architecture with the C4 model - Simon Brown, Agile on the Beach 2019. It is worth watching and Simon Brown hits the nail on the head with regards to the lost art of software architecture design.
His conceptualization of how to model systems architectures is simple, easy, and most importantly: useful. Visit the C4 Modeling website for a more comprehensive overview. The biggest advantage of practising C4 modelling is that it automatically guides you towards the solution and architecture you need. Your start from a zoomed-out perspective, and then drill in deeper and deeper, interrogating each part on its merits and solving for what architecture is needed to support the system.
C4 modelling in short
For an in-depth and much better explanation of the abstractions, notation and diagrams in C4, use the links above. The following is only an introduction.
C4 stands for the for 'C's found in the main diagram types:
- Context
- Container
- Components
- Code
Context Diagram
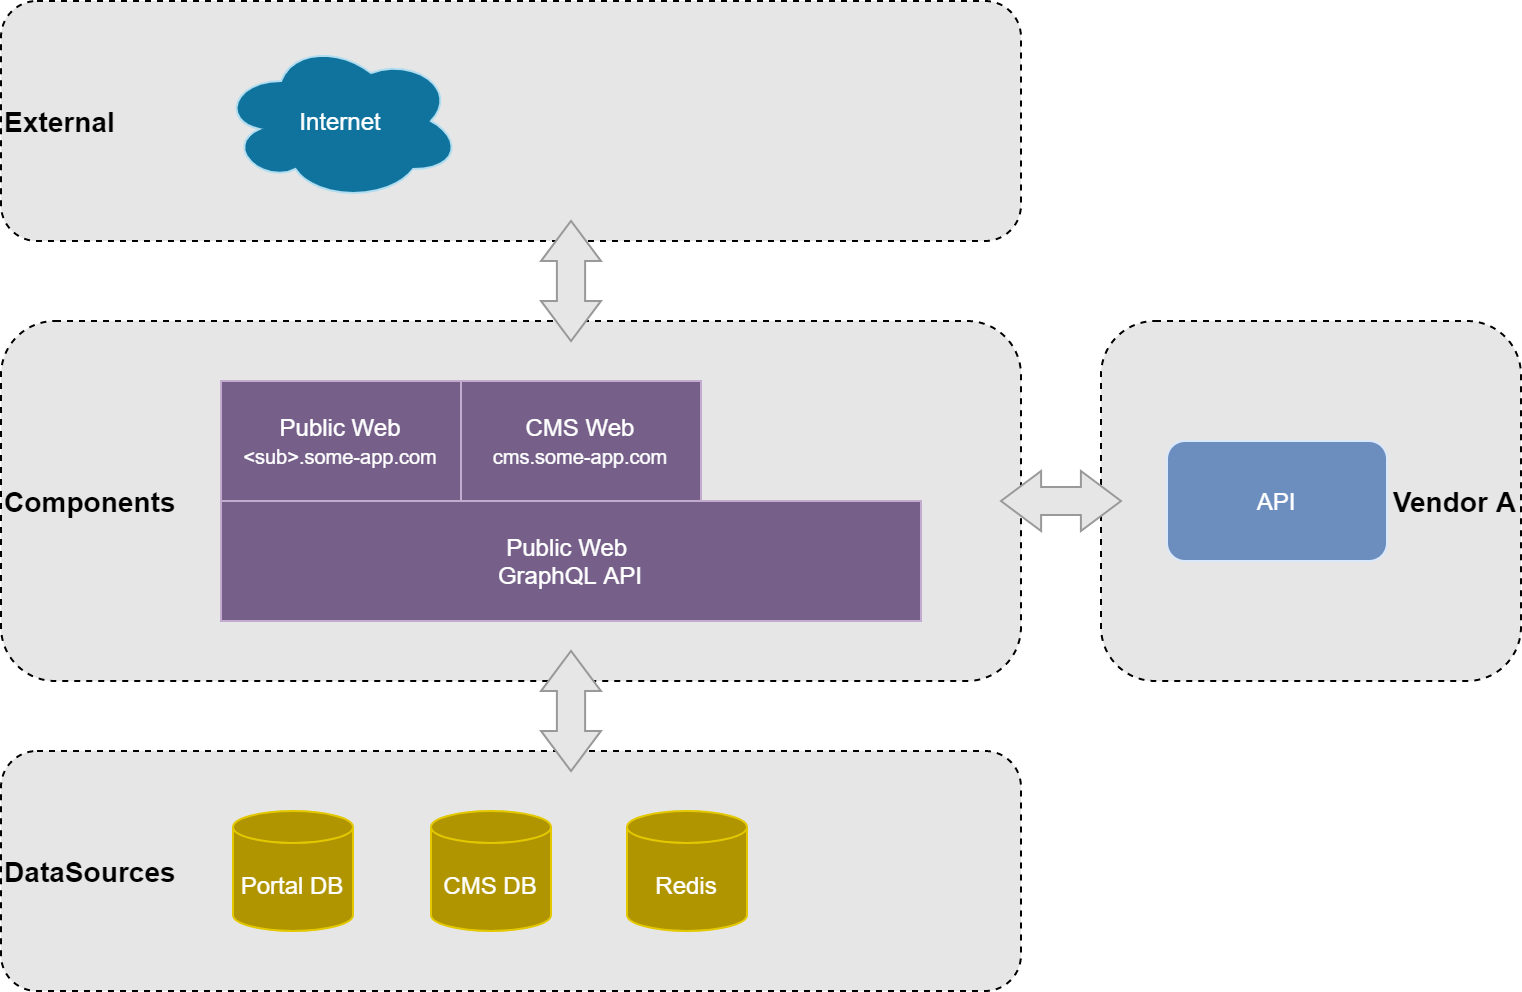
The context diagram's only purpose is to frame your system in relation to supporting systems, data sources and users. Nothing technical is described in it. Recreating our overview diagram from above as a C4 context diagram will yield something akin to the following.
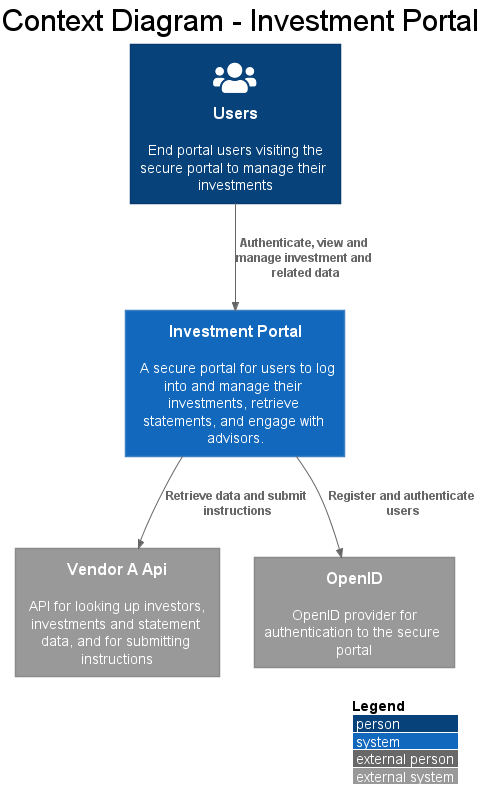
Note the copious use of text on the diagram. Information in an understandable way is the essence of C4. More textual information is not obscuring the diagram, it enhances the value of the diagram.
Container Diagram
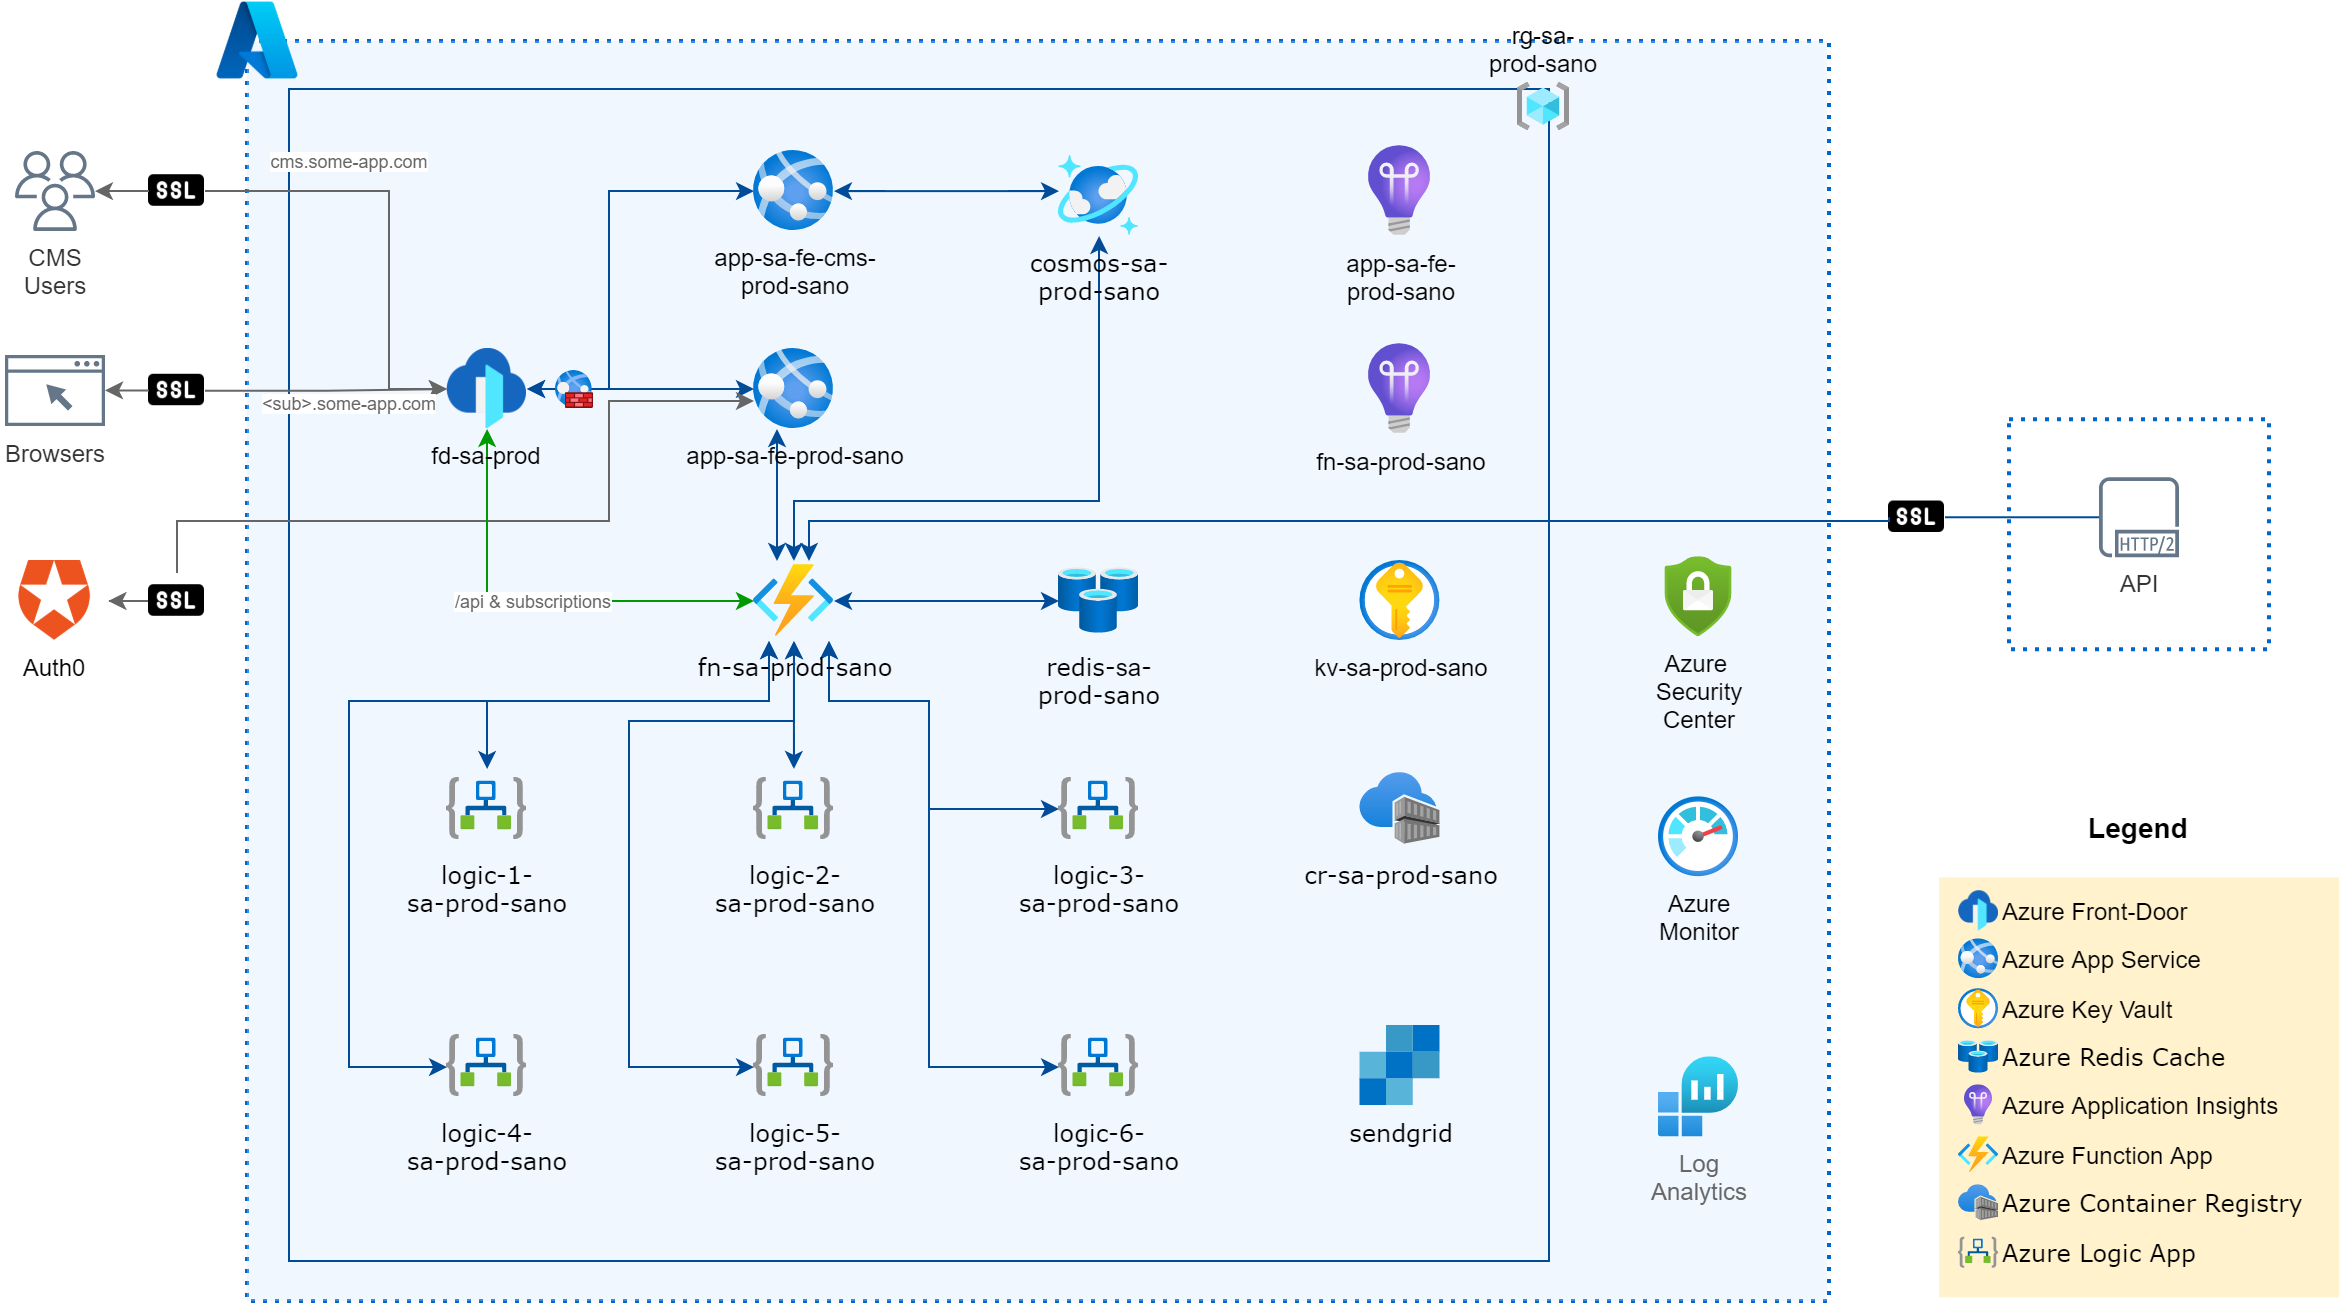
Container diagrams take the context diagram and zoom into the system we are architecting. It breaks the single system block into execution and data storage units, containers in C4 parlance, that will be deployable in some fashion. It also starts to shed light on the technology that will be used.
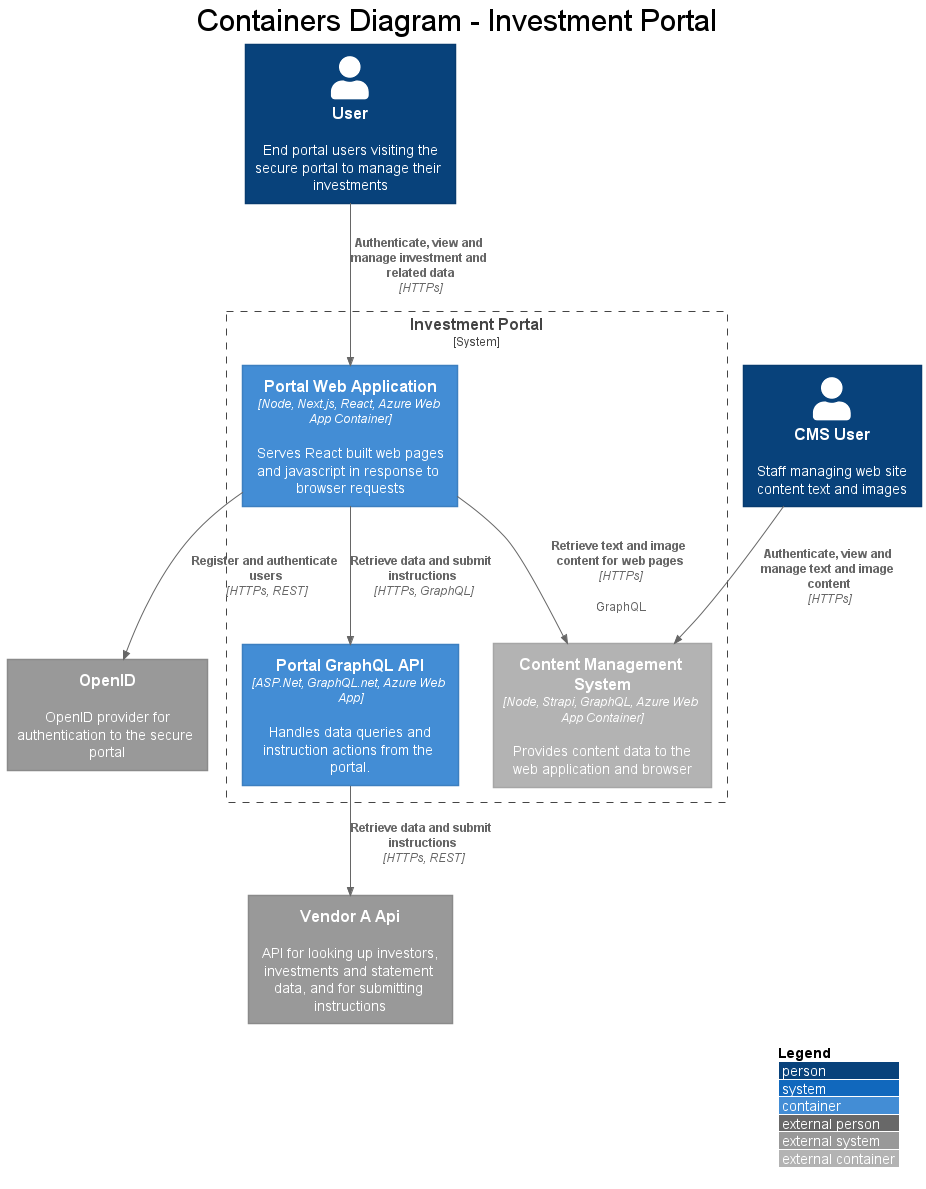
The system is now represented as being made up of distinct parts, that include the target technologies and a description of the container's purpose. It also shows in more detail now where interaction with external users and systems occur.
Component Diagrams
The next level deeper expands the relevant details of one of the identified containers. The exact detail needed on this diagram is more open to interpretation, but important structural parts to the make-up of a container and their interactions are what one wants to capture.
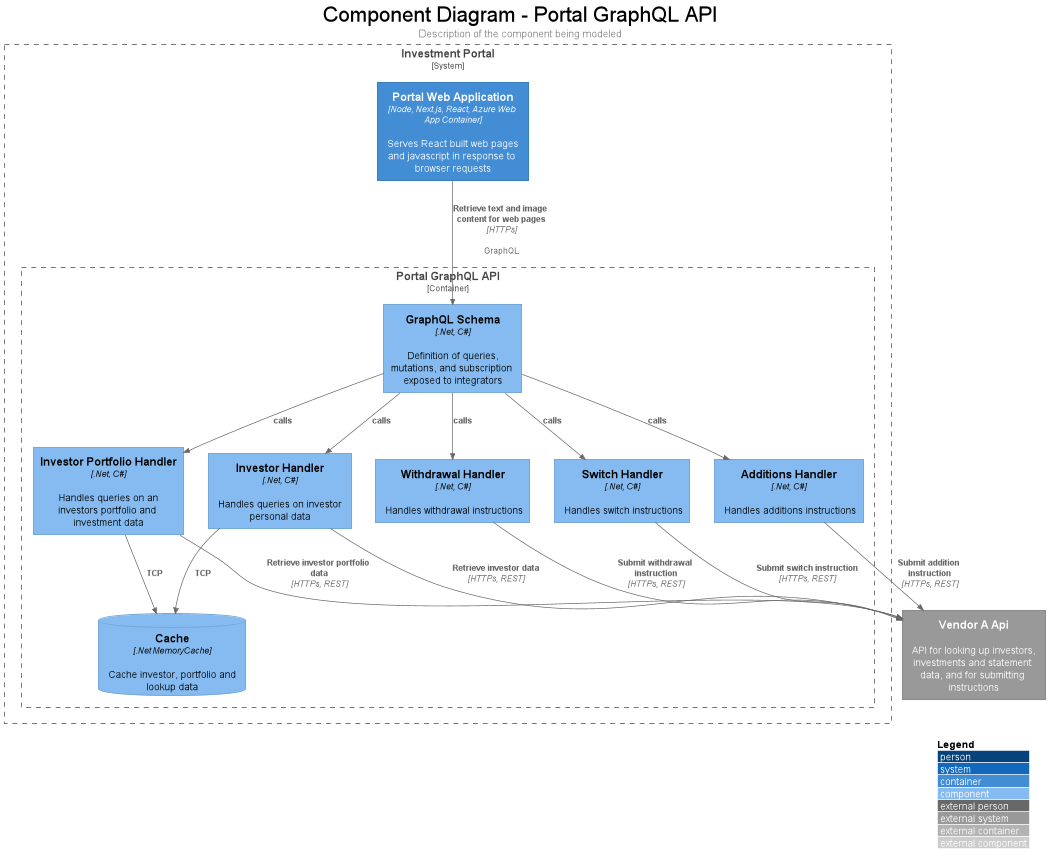
From the example diagram, you can see the most important aspects of the container that needs to be thought of. Some of the elements identified on the context and container diagrams are also not present here since they do not interact with the container.
Here I just show the API component diagram. There will be an equivalent Portal Web Application diagram too.
Code
In the video linked to above, Simon Brown recommends that you don't delve further into code diagrams unless required. From our own experience at NML, I agree with that viewpoint. You do not need to have every aspect of your system diagrammed out. The value successive level adds do not increase in step with the effort and difficulty involved in creating them. That doesn't mean that there aren't circumstances where code diagrams are justified.
I won't show code diagrams here as they are in general UML diagrams, like sequence or class diagrams.
Additional
There are 3 more diagrams defined by the C4 model which are optional but can be useful to clarify certain design aspects of the system. I won't go into detail here other than list them:
- System Landscape diagram
- Deployment diagram
- Dynamic diagram
Read up on them and experiment with them to find where they help your design process.
Conclusion
C4 modelling defines an approach to system architecture that is both informative and useful in helping with the architecture endeavour. Delving into successive diagrams from a more abstract view guides you into thinking about the interactions and solutions required to design the system. NML is pivoting toward using C4 modelling using PlantUML and the feedback from the technical teams thus far has been very positive.